The 1979 Cleveland Indians went 81-80, finishing 6th in the East.
- Not a terrible collection of hitters, with five players with an OPS+ over 114.
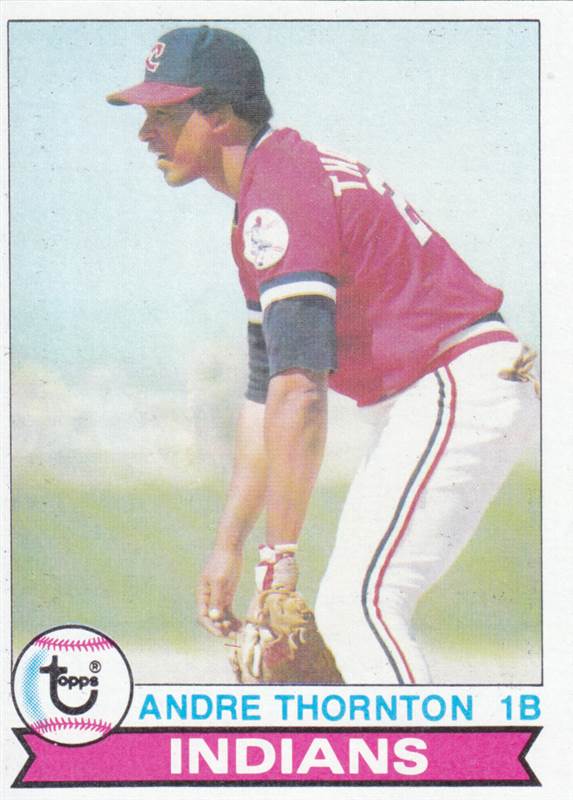
- Andre Thornton was a beast, going .233/.347/.449 and leading the team with 26 HR.
- Bobby Bonds, Rick Manning and Toby Harrah helped make sure the Indians led the American League in stolen bases. That is something, I guess.
- The pitching was…rough. Rick Wise and Rick Waits were 15 game winners, but their peripherals were not great.
- The teams closer Sid Monge was easily the teams best pitcher. Seems like they knew it too: 76 appearances, 131 innings. It was his best season in the majors and got him an All-Star selection.
Position Players
| Rk | Pos | Name | Age | G | AB | H | HR | SB | CS | BB | SO | BA | OBP | SLG | OPS | OPS+ |
|---|---|---|---|---|---|---|---|---|---|---|---|---|---|---|---|---|
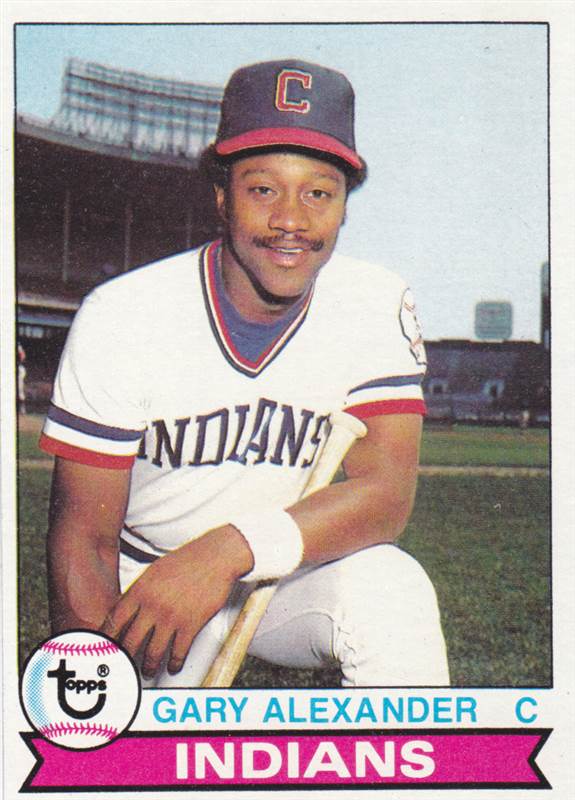
| 1 | C | Gary Alexander | 26 | 110 | 358 | 82 | 15 | 4 | 2 | 46 | 100 | .229 | .313 | .391 | .704 | 89 |
| 2 | 1B | Andre Thornton | 29 | 143 | 515 | 120 | 26 | 5 | 4 | 90 | 93 | .233 | .347 | .449 | .796 | 114 |
| 3 | 2B | Duane Kuiper* | 29 | 140 | 479 | 122 | 0 | 4 | 9 | 37 | 27 | .255 | .313 | .294 | .608 | 66 |
| 4 | SS | Tom Veryzer | 26 | 149 | 449 | 99 | 0 | 2 | 5 | 34 | 54 | .220 | .279 | .254 | .533 | 46 |
| 5 | 3B | Toby Harrah | 30 | 149 | 527 | 147 | 20 | 20 | 9 | 89 | 60 | .279 | .389 | .444 | .833 | 125 |
| 6 | LF | Mike Hargrove* | 29 | 100 | 338 | 110 | 10 | 2 | 3 | 63 | 40 | .325 | .433 | .500 | .933 | 152 |
| 7 | CF | Rick Manning* | 24 | 144 | 560 | 145 | 3 | 30 | 8 | 55 | 48 | .259 | .323 | .304 | .626 | 71 |
| 8 | RF | Bobby Bonds | 33 | 146 | 538 | 148 | 25 | 34 | 23 | 74 | 135 | .275 | .367 | .463 | .830 | 123 |
| 9 | DH | Cliff Johnson | 31 | 72 | 240 | 65 | 18 | 2 | 0 | 24 | 39 | .271 | .343 | .538 | .881 | 134 |
| 10 | OF | Jim Norris* | 30 | 124 | 353 | 87 | 3 | 15 | 10 | 44 | 35 | .246 | .328 | .348 | .676 | 83 |
Pitching Staff
| Rk | Pos | Name | Age | W | L | W-L% | ERA | G | GS | GF | CG | SV | IP | H | BB | SO | ERA+ | WHIP |
|---|---|---|---|---|---|---|---|---|---|---|---|---|---|---|---|---|---|---|
| 1 | SP | Rick Wise | 33 | 15 | 10 | .600 | 3.73 | 34 | 34 | 0 | 9 | 0 | 231.2 | 229 | 68 | 108 | 115 | 1.282 |
| 2 | SP | Rick Waits* | 27 | 16 | 13 | .552 | 4.44 | 34 | 34 | 0 | 8 | 0 | 231.0 | 230 | 91 | 91 | 96 | 1.390 |
| 3 | SP | Mike Paxton | 25 | 8 | 8 | .500 | 5.92 | 33 | 24 | 1 | 3 | 0 | 159.2 | 210 | 52 | 70 | 72 | 1.641 |
| 4 | SP | Len Barker | 23 | 6 | 6 | .500 | 4.92 | 29 | 19 | 3 | 2 | 0 | 137.1 | 146 | 70 | 93 | 87 | 1.573 |
| 5 | SP | Wayne Garland | 28 | 4 | 10 | .286 | 5.23 | 18 | 14 | 1 | 2 | 0 | 94.2 | 120 | 34 | 40 | 82 | 1.627 |
| 6 | SP | Eric Wilkins | 22 | 2 | 4 | .333 | 4.39 | 16 | 14 | 0 | 0 | 0 | 69.2 | 77 | 38 | 52 | 98 | 1.651 |
| Rk | Pos | Name | Age | W | L | W-L% | ERA | G | GS | GF | CG | SV | IP | H | BB | SO | ERA+ | WHIP |
| 7 | CL | Sid Monge* | 28 | 12 | 10 | .545 | 2.40 | 76 | 0 | 53 | 0 | 19 | 131.0 | 96 | 64 | 108 | 178 | 1.221 |
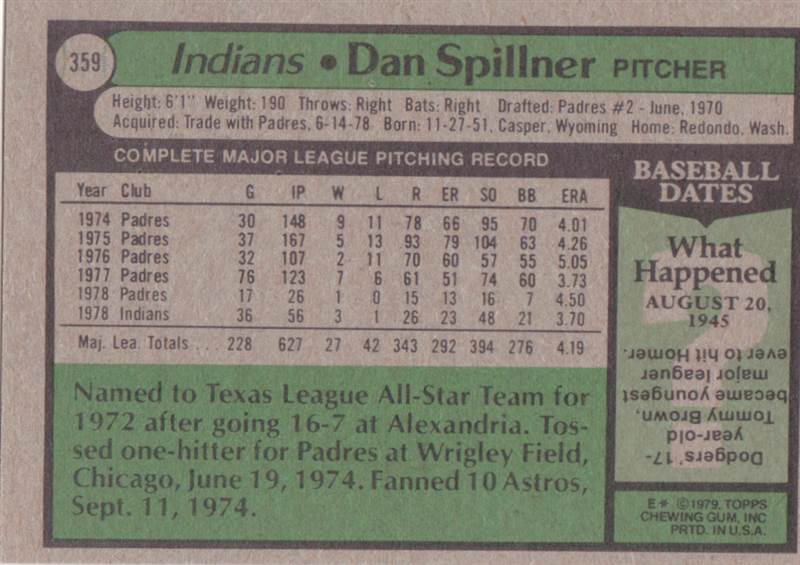
| 8 | RP | Dan Spillner | 27 | 9 | 5 | .643 | 4.62 | 49 | 13 | 14 | 3 | 1 | 157.2 | 153 | 64 | 97 | 93 | 1.376 |
| 9 | RP | Victor Cruz | 21 | 3 | 9 | .250 | 4.23 | 61 | 0 | 48 | 0 | 10 | 78.2 | 70 | 44 | 63 | 101 | 1.449 |
| 10 | RP | Paul Reuschel | 32 | 2 | 1 | .667 | 7.94 | 17 | 1 | 5 | 0 | 1 | 45.1 | 73 | 11 | 22 | 54 | 1.853 |
| 11 | RP | Don Hood* | 29 | 1 | 0 | 1.000 | 3.68 | 13 | 0 | 3 | 0 | 1 | 22.0 | 13 | 14 | 7 | 118 | 1.227 |
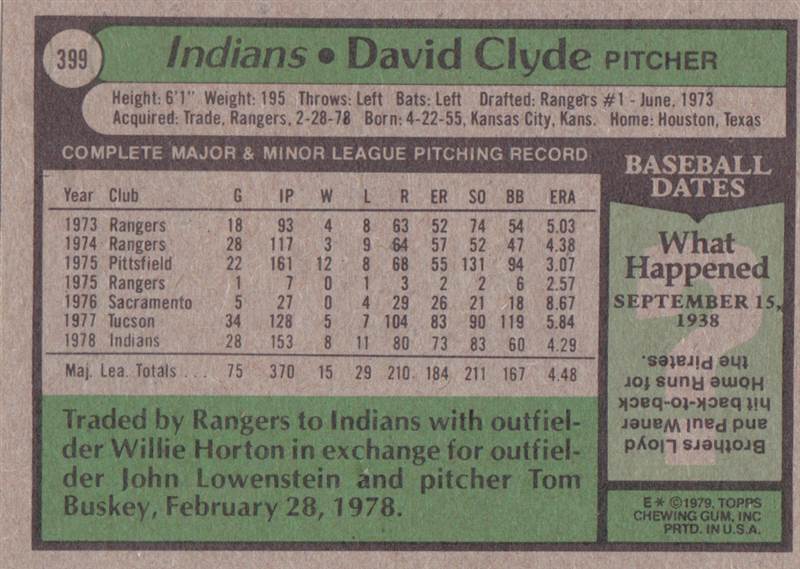
| 12 | David Clyde* | 24 | 3 | 4 | .429 | 5.91 | 9 | 8 | 1 | 1 | 0 | 45.2 | 50 | 13 | 17 | 73 | 1.380 |
The Set

#13 Paul Dade
")
#13 Paul Dade (b)

#38 Bernie Carbo
")
#38 Bernie Carbo (b)

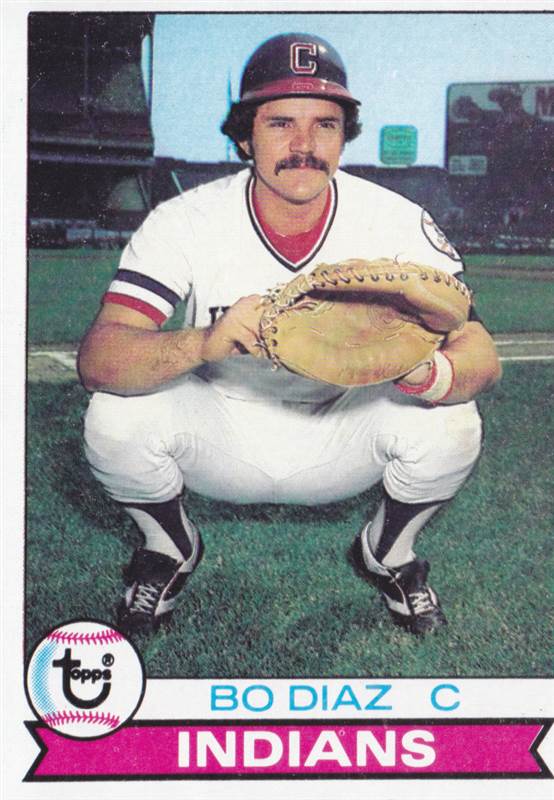
#61 Bo Diaz
")
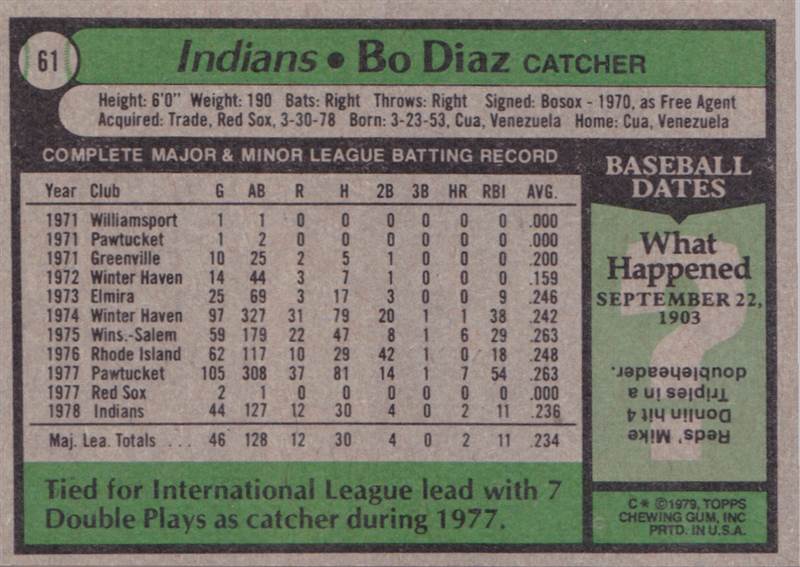
#61 Bo Diaz (b)

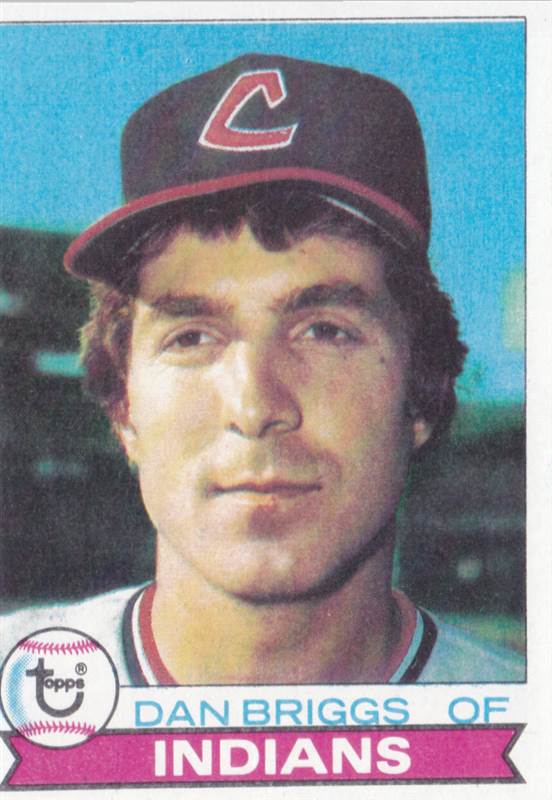
#77 Dan Briggs
")
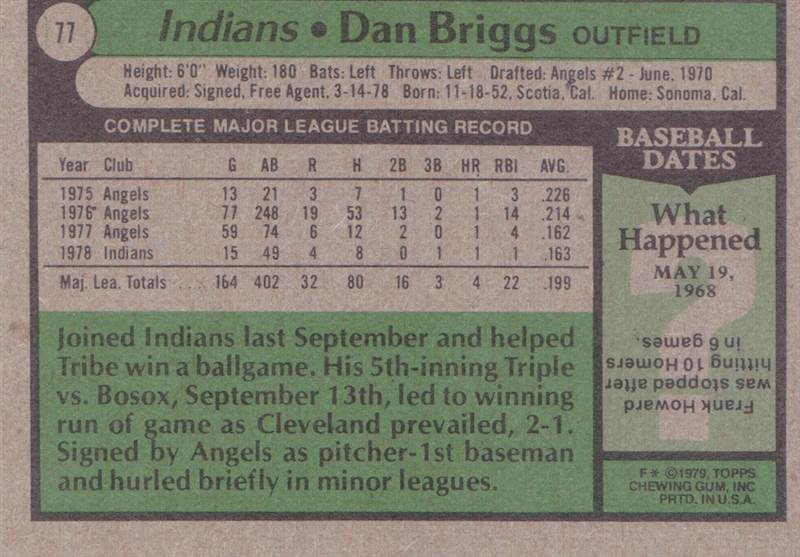
#77 Dan Briggs (b)

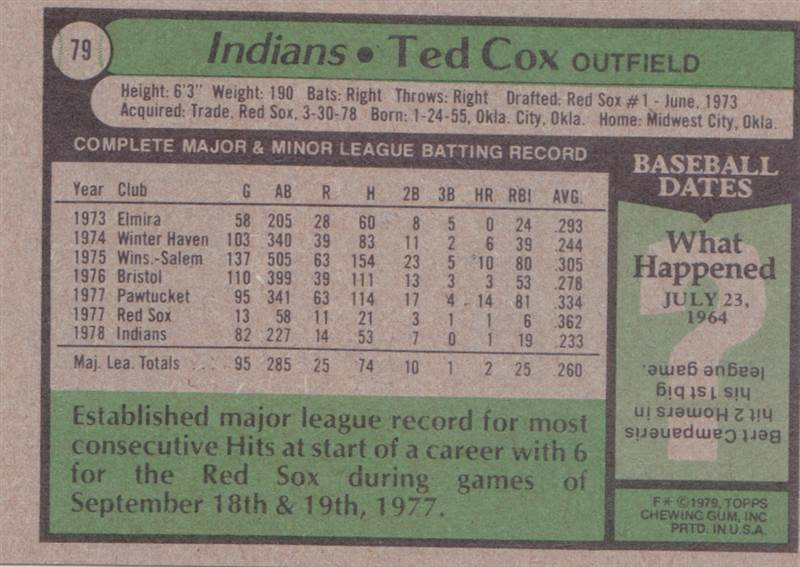
#79 Ted Cox
")
#79 Ted Cox (b)

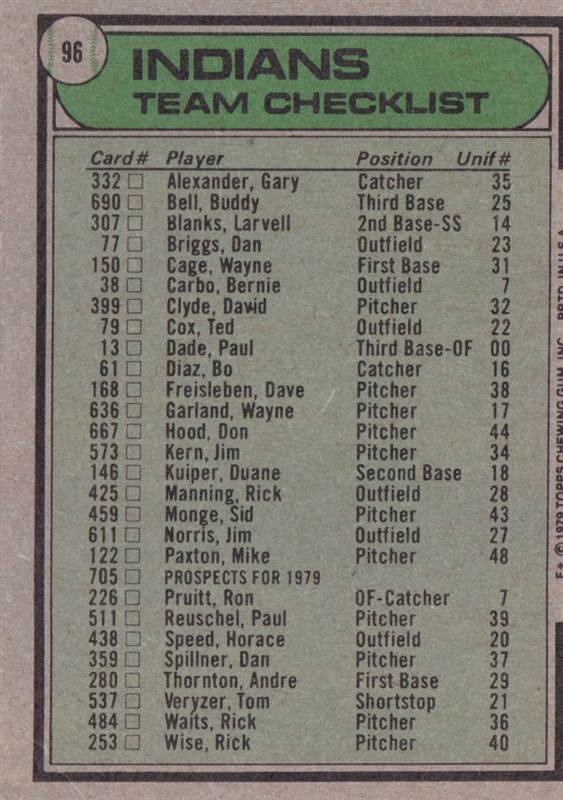
#96 Indians Checklist
")
#96 Indians Checklist (b)

#122 Mike Paxton
")
#122 Mike Paxton (b)

#146 Duane Kuiper
")
#146 Duane Kuiper (b)

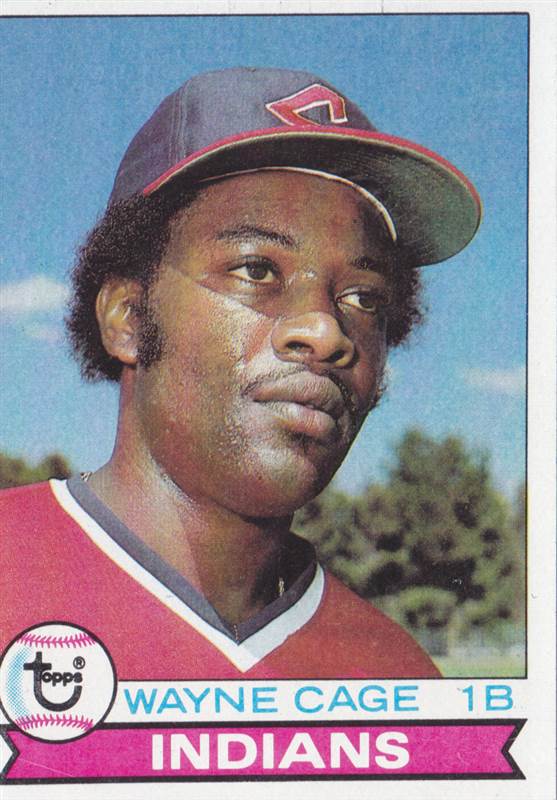
#150 Wayne Cage
")
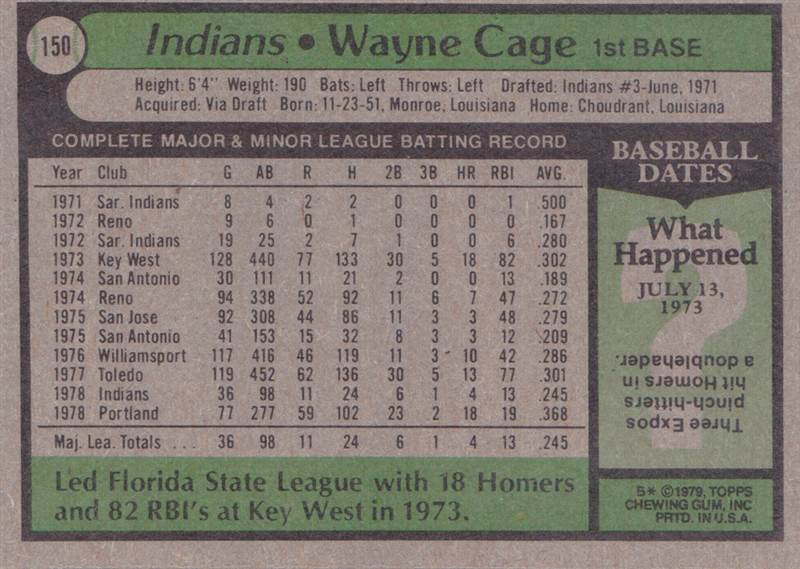
#150 Wayne Cage (b)

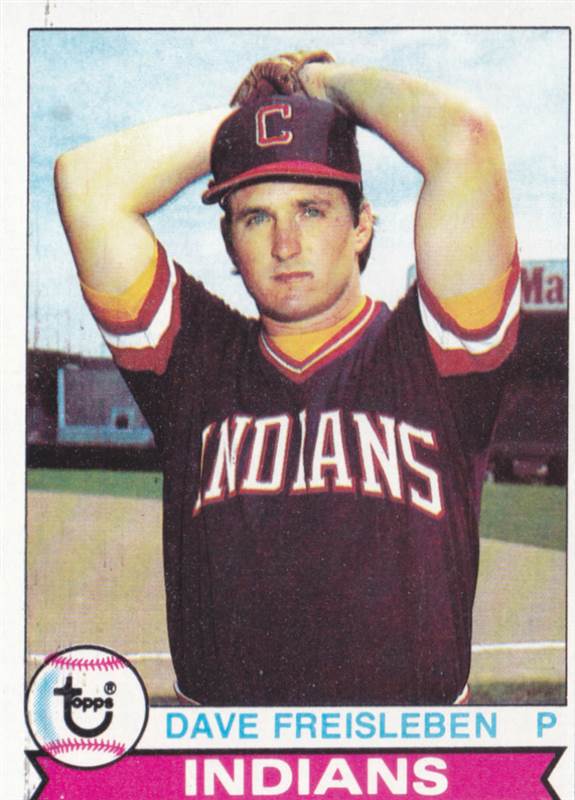
#168 Dave Freisleben
")
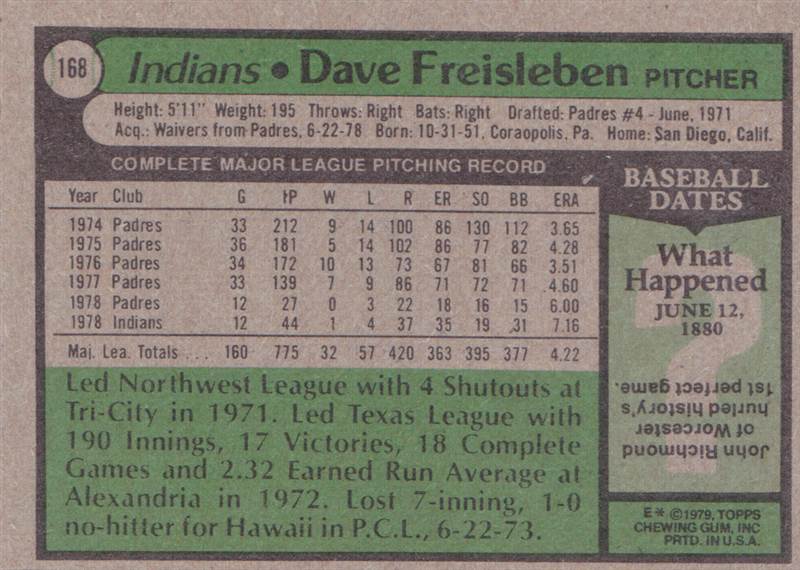
#168 Dave Freisleben (b)

#226 Ron Pruitt
")
#226 Ron Pruitt (b)

#253 Rick Wise
")
#253 Rick Wise (b)

#280 Andre Thornton
")
#280 Andre Thornton (b)
#307 Larvell Blanks
#307 Larvell Blanks (b)

#332 Gary Alexander
")
#332 Gary Alexander (b)

#339 David Clyde
")
#339 David Clyde (b)

#359 Dan Spillner
")
#359 Dan Spillner (b)

#425 Rick Manning
")
#425 Rick Manning (b)

#438 Horace Speed
")
#438 Horace Speed (b)

#459 Sid Monge
")
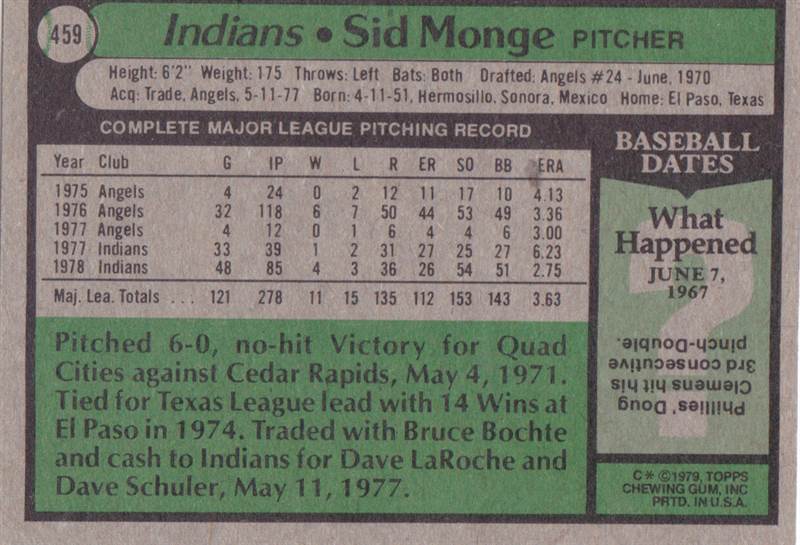
#459 Sid Monge (b)

#484 Rick Waits
")
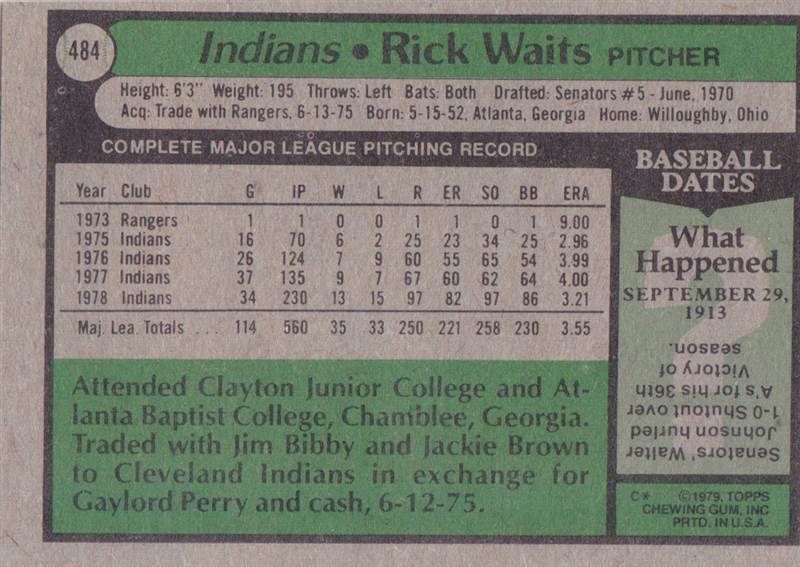
#484 Rick Waits (b)

#511 Paul Reuschel
")
#511 Paul Reuschel (b)

#537 Tom Veryzer
")
#537 Tom Veryzer (b)

#573 Jim Kern
")
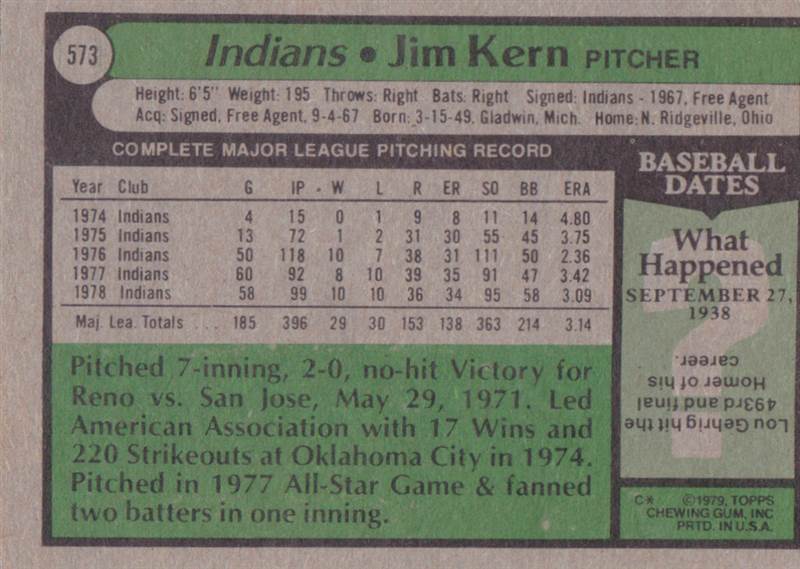
#573 Jim Kern (b)

#611 Jim Norris
")
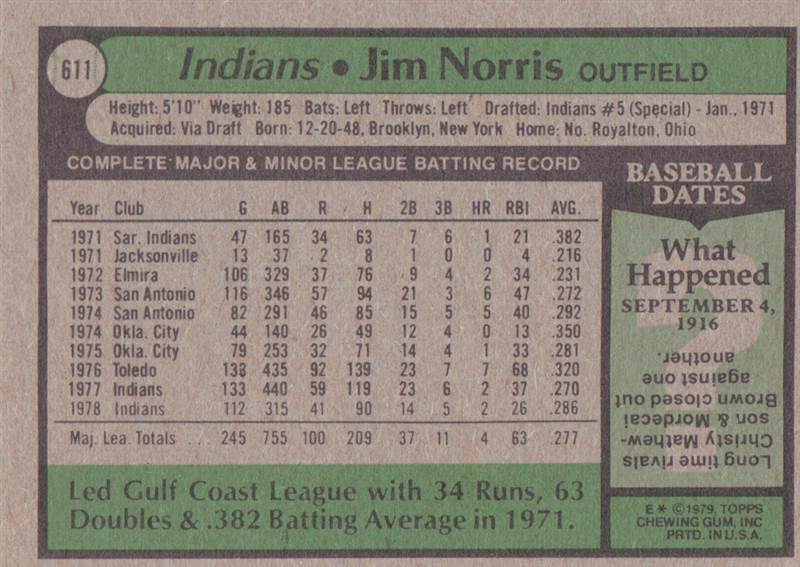
#611 Jim Norris (b)

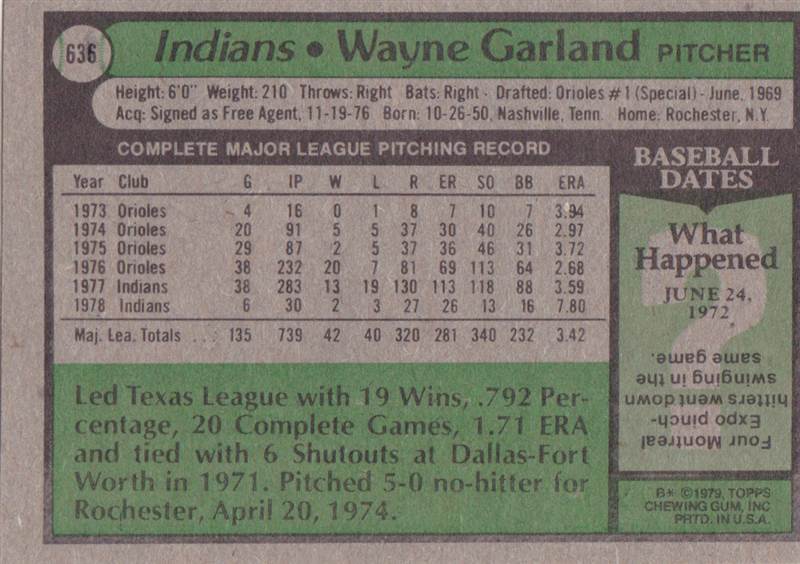
#636 Wayne Garland
")
#636 Wayne Garland (b)

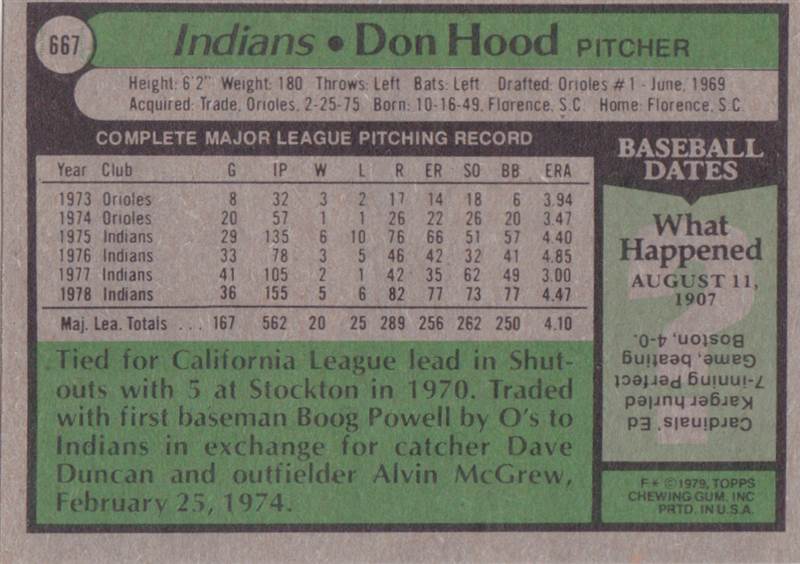
#667 Don Hood
")
#667 Don Hood (b)

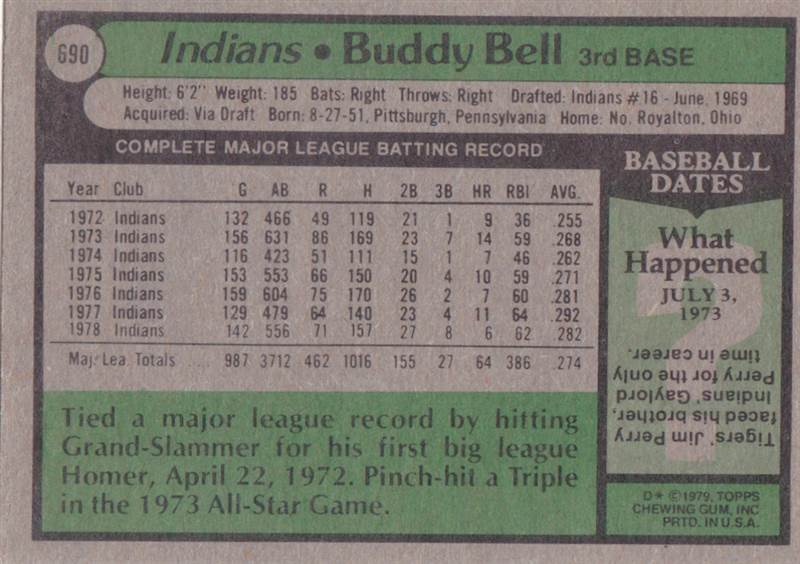
#690 Buddy Bell
")
#690 Buddy Bell (b)

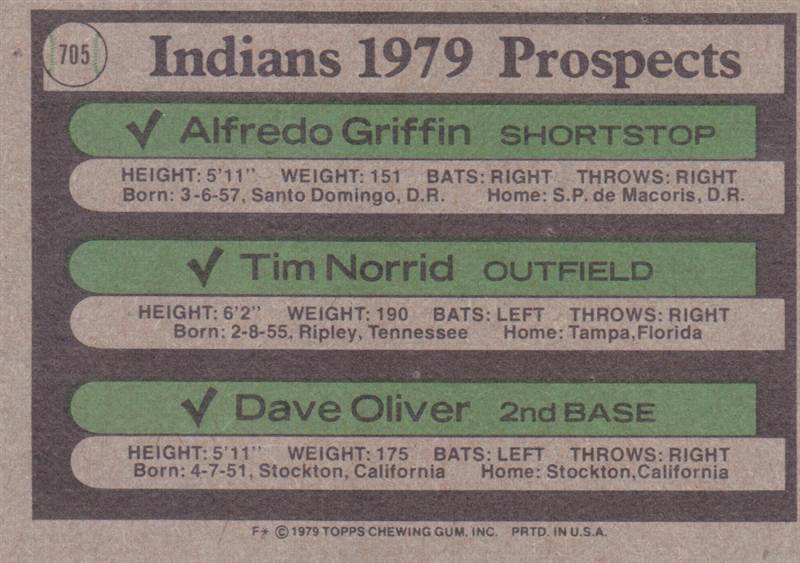
#705 Indians Prospects
")
#705 Indians Prospects (b)